
Macro equity trading strategies with risk management (paired trading when needed). Some might think these are crazy ideas but even a 'blind squirrel' will find a nut every now and then !
Blind Squirrel Trading Strategies

Custom Search
Friday, July 30, 2010
dow future down 81, S&P futures down 8, US GDP slows to 2.4%
Economy Grew 2.4% in Second Quarter, Slightly Less than Analysts Were Expecting
Thursday, July 29, 2010
S&P 500 opens strong and now down 11. Stalls at the Fibonacci Line again
Where is the market going ? Looks like talk of the double dip recession is fading. For the past 2 weeks, Wall Street has been focusing on earnings announcements and they are not that bad as first thought by the gurus. Plus Europe doesn't have as many banks failing after the stress test last Friday. Where is the market going ?
Well I am sticking to my thesis of volatility and the trading range I mentioned early in the month. I think the market has a greater chance of correcting than starting a new bull. What does the market do after earnings season ? .... focus on other news (economic stats, US state debt problems, credit crisis with the PIGS, Korea etc...) Time will tell !!! Be careful out there !!

Well I am sticking to my thesis of volatility and the trading range I mentioned early in the month. I think the market has a greater chance of correcting than starting a new bull. What does the market do after earnings season ? .... focus on other news (economic stats, US state debt problems, credit crisis with the PIGS, Korea etc...) Time will tell !!! Be careful out there !!

Friday, July 23, 2010


European Bank Stress Test will be announced today .... Which way will markets go ?
A bank fails the test if its Tier-1 capital ratio is below 6 percent under two scenarios: adverse scenario and adverse scenario plus sovereign risk.
The stress tests will show a failing mark for some of the German state banks and the Spanish savings banks (ones that the street already knows are poorly capitalized) . Some bigger banks will raise capital. A question this report likely has not answered is how much exposure each bank has to each nation’s debt. They may lump some things together to obscure bad news.
Will this instill confidence in the banks? Short term, yes. Longer term, no.

Monday, July 19, 2010
good question on CNBC...What Ammunition Does Fed Have Left For the Economy?
this is the link to CNBC for the full story: http://www.cnbc.com/id/38309275
Fed has already slashed interest rates to near zero, promised to hold them there for extended period, and flooded the economy with more than $1 trillion in additional credit to get things going.
Fed has already slashed interest rates to near zero, promised to hold them there for extended period, and flooded the economy with more than $1 trillion in additional credit to get things going.
What ammunition does the Fed have left?
(these are the 3 items that I think are possible)
Hold Mortgage-Related Asset Levels Steady on Balance Sheet
To ease the 2007-2009 financial crisis, the Fed bought about $1.3 trillion in mortgage-backed securities and debt issued by government-sponsored mortgage finance enterprises to lower mortgage rates, stimulate homebuying and push additional credit into the economy for banks to lend.
Buy More Assets
The Fed could buy more mortgage-backed securities, or since its holdings of MBS are already so large, it could buy more long-term Treasury securities. Moving to buy more assets only months after declaring its buying spree over would be a risky flip-flop for the Fed, which tries to be as steady and predictable as possible
Open a New Lending Facility
The Fed could open or keep open a lending facility to increase credit availability for any sector of the economy it wants to help, such as commercial real estate.
The Fed would have to argue that crisis conditions exist in order to lend to non-banks, and may be shy about doing so after similar actions were criticized during the 2007-2009 financial crisis.

Some bad news out of Europe .... How will this affect the opening bell in North America ?
The IMF and EU suspended on Saturday a review of Hungary's funding program, set up in 2008 to save the country from financial meltdown, saying it must take tough action to meet targets for cutting its budget deficit.
Suspension of talks means Hungary will not have access to remaining funds in its $25.1 billion loan package, created by the International Monetary Fund and European Union and which it now uses as financial safety net.
Australia market is down 1.5%
Japanese market is closed for a holiday
Hong Kong market is down 1%
Shanghai market is currently up 1.6% (on comment that Chinese Central Bank can achieve 3% inflation band. Can you say Bull Shit !)
News just out that Ireland's credit is being downgraded from Aa1 to Aa2 because loss of financial strength.
Credit spreads will widen and banks will tighten their grip on risk for the trading desk.
I think I smell a liquidity problem unless the EU and IMF open up their wallets again !
Friday, July 16, 2010
Dow dow 200 and S&P testing the 1070 range, down 25 points... banks beat forecast but future looks weaker.
I previously said that the financials and tech would likely lead the market.
Today we have both sectors weaker.
Google is down $27 or over 5% after missing analysts estimates for Q2.
Citigroup is down 4% and Bank of America is down about 8%. Both beat forecast but are showing a weaker future. The financial reform bill which will be passed next week has Wall Street worried on how these businesses will be affected. Nancy Bush, analyst at NAB Research said "It's going to be this way for the next several years. It's an extremely tough environment."
S&P 500 down 18 points. Hit resistance on the Fib Fan line (light blue on chart)

Now see if 1040 and 1020 hold next week. Maybe will take out the July 1 area of 1000. My previous thoughts were a summer trading range of 1070 high and 950 low.
Dow opens down 50 points and S&P 500 down 8 points as earnings are starting to disappoint... Europe following
Maybe my shorts will work out... today at least ?
http://blindsquirreltradingstrategies.blogspot.com/2010/07/oops-my-shorts-are-hurting-my.html
50% 1 year return is now only a 30% return after this recent rally.
http://blindsquirreltradingstrategies.blogspot.com/2010/07/oops-my-shorts-are-hurting-my.html
50% 1 year return is now only a 30% return after this recent rally.
Volatility Index fell by nearly 30% in less than two weeks
Volatility Index fell by nearly 30% in less than two weeks as the markets marched higher for seven consecutive days. Investors went from panic to euphoria.
I don't think much has changed but the markets were pretty oversold a few weeks ago. Will we take out the S&P lows from early in July ? This rally was on lower "summer holiday" type volume. Not a sign of a new bull market. Check out my postings from July 1 for why I think markets will get ugly. Staying short for now !
I don't think much has changed but the markets were pretty oversold a few weeks ago. Will we take out the S&P lows from early in July ? This rally was on lower "summer holiday" type volume. Not a sign of a new bull market. Check out my postings from July 1 for why I think markets will get ugly. Staying short for now !
Merrill Lynch’s technical team is recommending investors sell into recent strength
Merrill Lynch’s technical team is recommending investors sell into recent strength as they view the medium term risks remaining high. According to Merrill, sentiment levels set the table for a summer rally that should fail heading into the third quarter.
will techs fall today ? GOOG is down in pre-markets after reporting. will tech drag market...
Citi, Bank of America and GE reported and pleased pre-market futures. Likely another volatile day. What else is new !
Thursday, July 15, 2010
Illinois default risk greater than Iceland: Will Other States Follow? US will have its own Greece !
Illinois made headlines a few weeks ago when it overtook California as the worst credit risk among American states. Now, the fifth most populous state in the U.S. has officially overtaken Iceland in the default risk category as well.
Iceland, as we know, suffered from one of the largest banking collapses in 2008, essentially went bankrupt, and has been stuck in the "2008–2010 Icelandic financial crisis” ever since.
So, for Illinois to jump ahead of the Arctic country-- in terms of default risk-- is no small feat, to say the least.
Just what kind of trouble is Illinois in? The State is looking at a two-year budget deficit going into FY2011 of at least $12.8 billion.
For 2009 to 2012, U.S. states would have nearly $300bn in budget deficits, according to figures from the National Association of State Budget Officers (Nasbo). Meanwhile, the Center on Budget and Policy Priorities projected that states’ cumulative budget shortfall will probably reach $140bn in the coming year, the biggest yet.
So, when the urgency of the European debt crisis subsides, and the bond market shifts its focus away from Europe and onto the United States, America could have its own-- Greece, or even PIIGS --of some sort, as early as next year.
Earnings releases from J.P. Morgan before opening bell and Google at closing bell Thursday
These reports could provide some gas for the fire. Either to help it take off or maybe burn down the house.
Also on tap for Thursday, weekly jobless claims, reported at 8:30 a.m. Other U.S. data includes PPI producer inflation data, and the Empire State survey, both at 8:30 a.m. Industrial production is reported at 9:15 a.m. and the Philadelphia Fed survey is at 10 a.m.
High unemployment is one the biggest frustrations of the economic recovery. The Fed, in fact, in cutting its GDP forecast, also provided a worse forecast for unemployment.
Citigroup and Bank of America follow J.P. Morgan, with earnings reports Friday.
Will the financials lead the way ? Up or down ?
Also on tap for Thursday, weekly jobless claims, reported at 8:30 a.m. Other U.S. data includes PPI producer inflation data, and the Empire State survey, both at 8:30 a.m. Industrial production is reported at 9:15 a.m. and the Philadelphia Fed survey is at 10 a.m.
"Anything less than 450,000 (jobless claims) will be a psychological boost for the market. I think we have to get down there and hold those levels," said Jeffrey Kleintop, chief market strategist at LPL Financial. Economists expect claims of 445,000 after last week's 454,000.
Citigroup and Bank of America follow J.P. Morgan, with earnings reports Friday.
Will the financials lead the way ? Up or down ?
China's economy slowed in the second quarter
Annual gross domestic product growth moderated to 10.3 percent from 11.9 percent in the first quarter.
One analyst (Don Straszheim, senior managing director & head of China research at ISI Group) thinks China's economy may slow further to 7 percent by year-end.
One analyst (Don Straszheim, senior managing director & head of China research at ISI Group) thinks China's economy may slow further to 7 percent by year-end.
“I think there is more risk in China that the economy gets too slow, than the inflation rate gets too hot,” he told CNBC on Thursday.
Tuesday, July 13, 2010
will financials sell off again on passing of the bill
President Barack Obama on Tuesday secured the 60 votes he needs in the Senate to pass a sweeping overhaul of financial regulations, all but ensuring that he soon will sign into law.
The 2,300-page bill aims to address regulatory weaknesses blamed for the 2008 financial crisis that fueled the worst recession since the 1930s.
It gives regulators broad authority to rein in banks, limit risk-taking by financial firms and supervise previously unregulated trading. It also makes it easier to liquidate large, financially interconnected institutions, and it creates a new consumer protection bureau to guard against lending abuses.
my short positions are killing my portfolio. What happened to the bad forward looking earnings announcements for Q3 ?
Cramer said last night on his 'Mad Money' show (CNBC) that last week's rally was for real. 5 of 6 items required for the start of a new bull have now happened.
Market has gone from oversold to short term overbought very quickly. What happened to the 'Death Cross' ?
Market has gone from oversold to short term overbought very quickly. What happened to the 'Death Cross' ?
Monday, July 12, 2010
Thursday, July 8, 2010

Wednesday, July 7, 2010
Raymond James' Chief Investment Strategist Jeff Saut is cautious.
Raymond James' Chief Investment Strategist Jeff Saut is out with his weekly report. While he still advocates caution, he notes that such extreme pessimism can often be seen as a contrarian signal. As such, it would not surprise him to see a rally as stocks have been compressed on a short-term basis.
Of the negative signs, Saut cites:
Of the negative signs, Saut cites:
- Dow Theory sell signal
- His proprietary trading indicator flashing 'sell' (for the first time since December 2007)
- Negative readings on the monthly stochastic indicator
- Downside violation of the 12-month moving average in stocks (most stocks have broken 'triple-bottoms')
- A death cross (where the 50 day moving average crosses below the 200 day moving average)
Oops... my shorts are hurting my performance, last week 50%, now 35% for the year.
It would be nice to see some crappy news in the last 1/2 hour ! LOL
I won't panic. Yet !!!
Quoting Gartman: Capital comes in 2 varieties, mental capital and that which is in your account. Of the 2, mental capital is the more important. Holding losing positions cost measurable sums of actual capital, but it cost immeasurable sums of mental capital.
Ace Greenberg, CEO of Bear Stearns (he was at BS for 61 years) used to chair a meeting of the risk committee every Monday morning, whose agenda was to enforce limits on the extent of capital exposure. As a rule, losing positions got sold on Friday, and he didn't care how nasty a hit the firm had to take by 4 PM. Monday all the dogs better have been off the books !
1060 is now short term resistance and 1040 is short term support

Last week, I said that 1075 and 950 would be the trading range over the summer. Let's see how good my technical prediction will be. Now 1060 is short term resistance and 1040 is short term support. I think after 2 big days, the shorts will come back into the market. Hang on tight !
markets open for 90 minutes and S&P 500 is up @ 1045 & UNG filled
My short positions are being beat up for past 2 days. I said Friday that I thought there was a technical bounce coming. The market needs to hold 1040 to shake up the bears. I am holding tight & hoping the bounce is finished soon.
One thing on this bounce my nat gas (UNG) was filled. This I hope will be near the bottom for the summer. Broke the "never average down" rule. Hope it pays off.
Writing this message from my iPhone. I will write more when I'm at my computer.
Watching to see how Europe closes the day (10:30 EST) & other data released later today.
Tuesday, July 6, 2010
Economic data to watch for this week and averaging down nat gas position.
Today the Institute for Supply Management reported a slowdown in service sector growth. The ISM said its index of activity in the service sector fell to 53.8 in June from 55.4 in May, although a reading above 50 indicates continued growth in the sector.
Tomorrow, we see other data to confirm a slowing US economy. Before markets open we see MBA Mortgage Applications and ICSC Retail Store Sales, then a 1/2 hour into trading we see the Redbook Chain Store Sales,
On Thursday, we see Monthly retail same-store sales, Initial Jobless Claims, and at 10:30 EST EIA Natural Gas Inventory and 11:00 EST EIA Petroleum Inventories, then in the afternoon, Consumer Credit
I will monitor the UNG price in the morning and likely change my order to a market from the $7.75 open order (that I mentioned last week). I almost was filled today but missed by a few pennies. The heat wave in the eastern seaboard will likely help reduce the nat gas inventories over the next few weeks (via increased air conditioner use therefore increased demand on nat gas fired electrical power generation) and the hurricane season might be an active one this summer (ie. rig shut downs in the Gulf, reduced supply). I think nat gas will be volatile and maybe I can convert my losing position of 2009 into a winner if I am nimble.


Was this the bounce on the S&P and now the technical traders resume with the shorts ?

Friday, July 2, 2010
Some history about gold... China and US$... Double dip recession ?.... long article but worth the read.
by: Gary Dorsch SirChartsAlot, Inc., Editor
The value of Gold has been subject to intense debate for centuries. Nathan Mayer Rothschild was once the richest man in Britain and probably in the world. His company, NM Rothschild, was appointed as the bullion broker to the Bank of England in 1840 and went on to operate the Royal Mint Refinery in 1852. When asked what the value of the barbaric metal was worth, Nathan used to reply, "I only know of two men who really understand the true value of gold—an obscure clerk in the basement vault of the Banque de Paris and one of the directors of the Bank of England. Unfortunately, they disagree.”
N M Rothschild & Sons rose to prominence in areas that included lending, underwriting government bonds, discounting commercial bills, direct trading in commodities, foreign exchange trading and arbitrage, as dealing in gold bullion. It was the brilliance and cunning of Nathan who paved the way for the firm to become the first international banking cartel.
In 1870 the Rothschilds formed the world's second largest oil producer, the Caspian and Black Sea Petroleum Company. The Rothschilds financed DeBeers Diamonds, becoming the biggest shareholder, and financed the railroad system of Europe and the Suez Canal for Britain. By 1905, the Rothschild interest in copper miner Rio Tinto amounted to 30-percent.
It was of great interest to bullion traders when on April 15th 2004, with the price of gold trading at $402 /ounce, NM Rothschild & Sons, which had fixed the price of gold twice a day for 85-years, suddenly announced its withdrawal from the London Gold Pool. By withdrawing from the Gold Pool, NM Rothschild was no longer obligated to sell its gold to anyone, including central banks. Were the Rothschilds anticipating some new dynamics that would send the yellow metal soaring to new heights?
Since then, the yellow metal has tripled in value to around $1,250 /oz. Central bankers overseeing emerging economies have become net buyers of gold, and mergers and acquisitions in the gold mining industry have put more of the yellow metal’s supply into fewer hands. Also tilting the balance into gold’s favor is the biggest explosion of the global fiat money supply in history.
Central bankers have monetized trillions of dollars worth of government bonds and mortgage debt in Euros, British pounds, Japanese yen, and US-dollars. In response, investors from all corners of the globe, including central banks in China, India, Russia, and Saudi Arabia, have been accumulating vast quantities of gold as a hedge to protect their purchasing power of their national reserves or savings.
Historically, Gold has been renowned as a hedge against inflation by tracking the direction of key commodities such as grains, crude oil, and industrial metals, for early clues about the future direction of inflation. Gold is also touted as a "safe haven," from tensions between warring nations, or dangers lurking from a global banking crisis. In recent years the very same factors that have caused global stock markets to plunge have helped the price of gold to climb sharply higher. Today the widespread integration of the global economy has made it possible for banking and economic failures in Europe or the US to destabilize the entire world economy.
Seeking to counter the worst downturn in the global economy since the Great Depression years of the 1930’s, the "Group-of-20" finance ministers and central bankers initiated emergency support measures for their economies, which included issuing trillions in sovereign debt and printing trillions in paper currency. The IMF calculates debt in the Group of 20 economies will reach 118% of GDP in 2014, up from about 80% before the crisis, yet so far the massive issuance of G-20 debt has avoided the ire of bond investors and credit rating companies.
However, one of the key drivers that’s been propelling the gold market to record heights is the massive build-up of debt, issued by the world’s biggest debtor nations. The dynamic is based upon a simple equation. At the end of the day, more debt will equal more money printing by central banks. Japan for instance, is issuing a record 44-trillion yen ($473-billion) of bonds this fiscal year, as falling tax revenues and the rising costs of supporting an aging population widened Japan’s deficit. (sounds like North America ?)
When Far Eastern central bank buying of gold begins to outstrip Western central bank selling, the price of gold could soar to levels that most observers can scarcely imagine today. China has vaulted ahead of India to become the world’s biggest gold consumer, buying 461-tons last year spurred by ultra-low Chinese bank deposit rates of 2.25% that are yielding less than the rate of inflation. Turnover of spot gold traded on the Shanghai Gold Exchange increasing +22.6% last year, and totaled 1.1-trillion yuan (US$162-billion).
 China is also the world’s largest gold miner with output reaching a total of 310 tons in 2009. In Shanghai traders keep an eye on the size of China’s foreign currency reserves which has mushroomed to $2.45 trillion. Traders suspect the government is diversifying its currency holdings into gold—clandestinely buying the yellow metal directly from state owned miners—and at lower prices than elsewhere.
If Beijing is buying gold from its own miners, then it’s exporting less and keeps supplies off the world markets. The Chinese Politburo doesn’t need to disclose the size of its official gold reserves to the world until it deems the timing to be strategically advantageous. China is in a tenuous position since any announcement of even a small increase in its gold reserves could jettison the yellow metals' price sharply higher. Beijing can play this card if or when it wishes to.
 However, the Chinese Politburo no longer has the luxury of stimulating its exports by keeping its currency pegged at an artificially low level compared to the US-dollar. Instead, under the mounting threat of protectionist legislation that’s targeting Chinese exports, and is veto-proof in the US Congress, Beijing has grudgingly agreed to engineer a gradual devaluation of the US dollar versus the yuan.
Beijing hasn’t disclosed the size of the upcoming devaluation of the US dollar in order to dissuade currency speculators from jumping on the bandwagon. However, on June 23rd, angry US senators said they are not impressed by China's baby steps to partly free the yuan and vowed to push forward legislation to punish a Chinese currency misalignment of as much as 40% against the US dollar exchange rate, which the US senators say distorts trade and steals jobs.
The specter of a Chinese, US trade war is just one of several worries that is driving the Shanghai red-chip index sharply lower this year. The Shanghai Composite index has tumbled to 2,427, its lowest close in 14 months, and is on course for a 22% slide over the second quarter as the Euro zone debt crisis and a tighter Chinese monetary policy fueled a broad selloff. Property stocks have been very hard hit amid fears that China’s real estate market could soon begin to deflate, which in turn would badly hurt the earnings of China’s top banks.
On June 18th Xia Bin, one of three top advisers on the People’s Bank of China's (PBoC) monetary committee, said China must pursue policies to tighten liquidity this year to deflate asset bubbles. He urged the PBoC and bank regulators to stick to plans to reduce new bank lending and curb property speculation. PBoC deputy Su Ning signaled that the central bank is aiming to slow the growth of China’s M2 money supply to +17%, from a +21% clip in May, and is also targeting 7.5 trillion yuan in new loans for this year, or roughly half of last year’s supply of credit.
This means that China's economy, the world’s biggest buyer of base metals, would likely slow from a +11.9% annualized growth rate in the first quarter to around 8% growth by year’s end. The dollar's upcoming devaluation, and/or threat of tariffs in the United States, is also likely to take a bite out of Chinese exports. Thus, global stock market operators cannot expect China to continue as the world’s economic locomotive that would protect it from the specter of a "double dip" recession.
The value of Gold has been subject to intense debate for centuries. Nathan Mayer Rothschild was once the richest man in Britain and probably in the world. His company, NM Rothschild, was appointed as the bullion broker to the Bank of England in 1840 and went on to operate the Royal Mint Refinery in 1852. When asked what the value of the barbaric metal was worth, Nathan used to reply, "I only know of two men who really understand the true value of gold—an obscure clerk in the basement vault of the Banque de Paris and one of the directors of the Bank of England. Unfortunately, they disagree.”
N M Rothschild & Sons rose to prominence in areas that included lending, underwriting government bonds, discounting commercial bills, direct trading in commodities, foreign exchange trading and arbitrage, as dealing in gold bullion. It was the brilliance and cunning of Nathan who paved the way for the firm to become the first international banking cartel.
In 1870 the Rothschilds formed the world's second largest oil producer, the Caspian and Black Sea Petroleum Company. The Rothschilds financed DeBeers Diamonds, becoming the biggest shareholder, and financed the railroad system of Europe and the Suez Canal for Britain. By 1905, the Rothschild interest in copper miner Rio Tinto amounted to 30-percent.
It was of great interest to bullion traders when on April 15th 2004, with the price of gold trading at $402 /ounce, NM Rothschild & Sons, which had fixed the price of gold twice a day for 85-years, suddenly announced its withdrawal from the London Gold Pool. By withdrawing from the Gold Pool, NM Rothschild was no longer obligated to sell its gold to anyone, including central banks. Were the Rothschilds anticipating some new dynamics that would send the yellow metal soaring to new heights?
Since then, the yellow metal has tripled in value to around $1,250 /oz. Central bankers overseeing emerging economies have become net buyers of gold, and mergers and acquisitions in the gold mining industry have put more of the yellow metal’s supply into fewer hands. Also tilting the balance into gold’s favor is the biggest explosion of the global fiat money supply in history.
Central bankers have monetized trillions of dollars worth of government bonds and mortgage debt in Euros, British pounds, Japanese yen, and US-dollars. In response, investors from all corners of the globe, including central banks in China, India, Russia, and Saudi Arabia, have been accumulating vast quantities of gold as a hedge to protect their purchasing power of their national reserves or savings.
Historically, Gold has been renowned as a hedge against inflation by tracking the direction of key commodities such as grains, crude oil, and industrial metals, for early clues about the future direction of inflation. Gold is also touted as a "safe haven," from tensions between warring nations, or dangers lurking from a global banking crisis. In recent years the very same factors that have caused global stock markets to plunge have helped the price of gold to climb sharply higher. Today the widespread integration of the global economy has made it possible for banking and economic failures in Europe or the US to destabilize the entire world economy.
Seeking to counter the worst downturn in the global economy since the Great Depression years of the 1930’s, the "Group-of-20" finance ministers and central bankers initiated emergency support measures for their economies, which included issuing trillions in sovereign debt and printing trillions in paper currency. The IMF calculates debt in the Group of 20 economies will reach 118% of GDP in 2014, up from about 80% before the crisis, yet so far the massive issuance of G-20 debt has avoided the ire of bond investors and credit rating companies.
However, one of the key drivers that’s been propelling the gold market to record heights is the massive build-up of debt, issued by the world’s biggest debtor nations. The dynamic is based upon a simple equation. At the end of the day, more debt will equal more money printing by central banks. Japan for instance, is issuing a record 44-trillion yen ($473-billion) of bonds this fiscal year, as falling tax revenues and the rising costs of supporting an aging population widened Japan’s deficit. (sounds like North America ?)
When Far Eastern central bank buying of gold begins to outstrip Western central bank selling, the price of gold could soar to levels that most observers can scarcely imagine today. China has vaulted ahead of India to become the world’s biggest gold consumer, buying 461-tons last year spurred by ultra-low Chinese bank deposit rates of 2.25% that are yielding less than the rate of inflation. Turnover of spot gold traded on the Shanghai Gold Exchange increasing +22.6% last year, and totaled 1.1-trillion yuan (US$162-billion).
If Beijing is buying gold from its own miners, then it’s exporting less and keeps supplies off the world markets. The Chinese Politburo doesn’t need to disclose the size of its official gold reserves to the world until it deems the timing to be strategically advantageous. China is in a tenuous position since any announcement of even a small increase in its gold reserves could jettison the yellow metals' price sharply higher. Beijing can play this card if or when it wishes to.
Beijing hasn’t disclosed the size of the upcoming devaluation of the US dollar in order to dissuade currency speculators from jumping on the bandwagon. However, on June 23rd, angry US senators said they are not impressed by China's baby steps to partly free the yuan and vowed to push forward legislation to punish a Chinese currency misalignment of as much as 40% against the US dollar exchange rate, which the US senators say distorts trade and steals jobs.
The specter of a Chinese, US trade war is just one of several worries that is driving the Shanghai red-chip index sharply lower this year. The Shanghai Composite index has tumbled to 2,427, its lowest close in 14 months, and is on course for a 22% slide over the second quarter as the Euro zone debt crisis and a tighter Chinese monetary policy fueled a broad selloff. Property stocks have been very hard hit amid fears that China’s real estate market could soon begin to deflate, which in turn would badly hurt the earnings of China’s top banks.
On June 18th Xia Bin, one of three top advisers on the People’s Bank of China's (PBoC) monetary committee, said China must pursue policies to tighten liquidity this year to deflate asset bubbles. He urged the PBoC and bank regulators to stick to plans to reduce new bank lending and curb property speculation. PBoC deputy Su Ning signaled that the central bank is aiming to slow the growth of China’s M2 money supply to +17%, from a +21% clip in May, and is also targeting 7.5 trillion yuan in new loans for this year, or roughly half of last year’s supply of credit.
This means that China's economy, the world’s biggest buyer of base metals, would likely slow from a +11.9% annualized growth rate in the first quarter to around 8% growth by year’s end. The dollar's upcoming devaluation, and/or threat of tariffs in the United States, is also likely to take a bite out of Chinese exports. Thus, global stock market operators cannot expect China to continue as the world’s economic locomotive that would protect it from the specter of a "double dip" recession.
another scary chart... history repeating it self
Coming back to how history often repeats itself, another way to look at bubbles is their market weight within the S&P 500 and there have been two major bubbles in the past half century from which we can compare the present bubble in consumer related sectors (finance and consumer discretion). Using the energy 1980 bubble peak and the technology 2000 bubble peak, the consumer related sector peak is right on schedule in which it’s final leg down may continue for another two and half years with a bottom projected in the second half of 2012. The image above and below should be taken seriously for those overweight the consumer via the financial and consumer discretionary sectors. (again, work from Chris Puplava PFS Group, Fundamental Analyst)


I hope this doesn't happen but the chart makes you think ....“history does not repeat itself, but it does rhyme.”
Disturbing Long Term Trends
As Mark Twain said, “history does not repeat itself, but it does rhyme.” There is a certain rhythm to secular bear markets in that they often take a similar shape in magnitude and duration. Secular bear markets can last anywhere from 10-15 years and I have created a bubble composite based on three well known bubbles and secular bull market tops. The bubbles I used were the Dow Jones from the 1929 peak (Great Depression), gold’s 1980 top (beginning of The Great Moderation), and the Nikkei’s 1989 top (Japan’s Lost Decade). Taking the average path of the three bubbles and overlaying the data with the NASDAQ’s 2000 market top showed that there was a likelihood that 2010 would contain the next major market peak and that we would then have a long slide into the next low in 2013. The bubble composite has been uncannily accurate and projected a market peak in the first half of 2010 followed by a short snap back rally before plunging back to the 2009 lows. Given the bubble composite is an average of three paths the day to day noise is a bit filtered out though the declining trend for the next few years is as clear as day and is not the least bit encouraging.
( Chris Puplava PFS Group, Fundamental Analyst)


Late session recovery, markets positive with 15 min. to close...then a sell off. All indices finish down !


VXX struggling today. Gap down at open, tested the close and now heading down
I know there are less players in today and the volumes are down. I would expect greater volatility, not less. Maybe the shorts earlier this week did 'sell on rumor and bought on fact' after today's Jobs number. VXX EFT which tracks VIX (CBOE volatility index) is weaker and technically not looking as good as I predicted. I am still long and thinking there is more selling in the next while (have stated my reasons over the past few days). Maybe the traders are expecting a bounce next week after such oversold markets (7 down days).


UGLY !!!
Jobs report and other data adds to economic fears.
Stocks fall !!!
Economic recovery is losing steam.
The stock indices fall for a seventh straight day. The highly anticipated jobs data showed private employers added 83,000 jobs last month. Fewer than the 112,000 analysts had forecast. With the Independence Day weekend, most traders are sitting on the side and lightening up on positions. Can you say risk aversion. Market is quite oversold and maybe a bounce after the weekend is in the cards. Still watching the charts.
Thursday, July 1, 2010
152 point drop erased on Dow and only down 41 at the close.... is there an Easter Bunny ? Use technicals !!!
Shorts did some unwinding during the day. VIX spiked higher and then sold off. Short Euro/ long gold pair trade that worked last quarter was unwinding today (gold fell below $1200). Maybe market was too short going into the Jobs number for Friday. Playing the risk aversion I think is still the game. Maybe we had some cold feet from the shorts. Market might bounce tomorrow on either a better or worse Jobs number (the sell on rumor and buy on fact trade I mentioned earlier). I still think there are going to be some head winds as I mentioned yesterday with the upcoming earnings and Euro/Greece events. The death cross and other technicals will keep me less emotional and I will try to stay short market and long gold & nat gas. Is China and US slowing ? Is there going to be a lot more hurricanes in the Gulf ? Is there an Easter Bunny ? Who knows but the technicals are telling us something !
I believe .... if markets are going down the financials will participate
I know Gartman's Trading Rules say never to average down but I am a rule breaker.
I am averaging down on SKF (UltraShort Financials ProShares) and DOG (Short Dow30 ProShares)
buying 800 SKF @ 23.72
and buying 200 DOG @ 54.76
and buying 200 DOG @ 54.76
Also will average down my big error of 2009, UNG (United States Natural Gas) sometime in the next while. It is up 5% today but crude is down 5%. I will leave an open order to buy 1300 @ $7.75. Should have bought earlier this week. Woulda shoulda.. didn't. I was not focused for the past month or so. Oops !
I think nat gas is a buy because:
1) coming summer power demand from conditioners
2) the onset of the hurricane seasons
3) the imminent passage of a gas subsidies in congress
4) crude supply shortages caused by the deep water drilling ban
This will cause hedge funds that had been running big, successful shorts in natural gas to run for cover.

Death Cross on S&P 500 ???
What Does Death Cross Mean?
A crossover resulting from a security's long-term moving average breaking above its short-term moving average or support level.
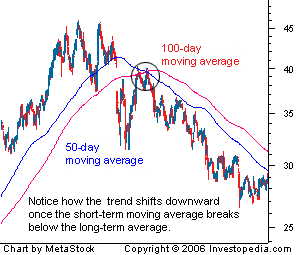
A crossover resulting from a security's long-term moving average breaking above its short-term moving average or support level.
1 hour to go before market closes and last chance to position trades before Jobs number Friday
I am amazed how the Fibonacci Fan lines for the 1 minute S&P 500 charts can predict short term support and resistance. There is 1 hour left before the markets close. Will traders sell before the bell and be less exposed on the US Jobs number for Friday morning. Is the US economy heading towards double dip recession ? Or is the market going to unwind the short positions that have been placed all through out this week (sell or rumor and buy on fact). Is the S&P pricing in a bad Jobs number ? VIX and markets were weaker but are fighting back since noon. July 4 will also keep some traders away with less volume and more vol. I guess we will have to see tomorrow if markets bounce or continue the break of support and start an ugly summer trading range.


Subscribe to:
Posts (Atom)
iPhone4 vs BlindSquirrelTradingStrategies.blogspot.com
You will understand if you watched the Youtube video that had over 5 million views last week...
http://www.youtube.com/wat