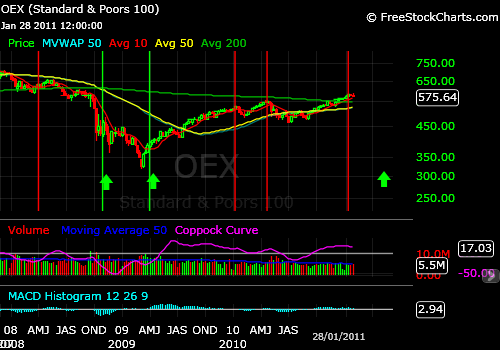
VIX is the ticker symbol for the Chicago Board Options Exchange Market Volatility Index, a popular measure of the implied volatility of S&P 500 index options. Often referred to as the fear index or the fear gauge, it represents one measure of the market's expectation of stock market volatility over the next 30 day period. The OEX is the S&P 100 index.
When the VIX is low, the market is complacent and ready for a correction and when the VIX is high, the market is scared and should be bought !!!
Horizontal green line shows when the market should be bought (high VIX reading or market has some bad news) and the horizontal red line shows when the market should be sold. (low VIX reading and market news is all goo)
Vertical red line corresponds with low VIX (SELL) and vertical green line corresponds with high VIX (BUY).
When is the next vertical green line or buy signal ??? Wait for the VIX to climb higher !!!
Blind Squirrel Trading Strategies
Custom Search
Friday, January 28, 2011
Wednesday, January 26, 2011
GMAK !!! Got My Ass Kicked in the past quarter with my bearish picks. Still up overall.
I think markets are ripe for a drop soon. There has been nothing for me to post as I just held tight and waited for a correction in the stock market since last fall. The opposite of a buy hold to profit. I did the buy hold and lost money. (remember this portfolio uses only ETFs and not individual stocks. Also, I try not to trade but take macro positions and pair trade to control risk. I have been bearish for the past year believing markets have been held up by the fed's bailouts and QE2)
I basically called the direction of the market wrong after the Fed kept the market a float the past few months.
VIX is looks like Mr Main Street investor is getting too complacent. China is worried about inflation and raising rates but Mr Main Street is still buying. Not much to talk about until earnings season is over. After that Mr Market will focus on Spain and other bankrupted countries, inflation in China & India, protesters in Egypt and other volatile countries and maybe even the problem with US muni bonds and the bankrupted states.
I basically called the direction of the market wrong after the Fed kept the market a float the past few months.
VIX is looks like Mr Main Street investor is getting too complacent. China is worried about inflation and raising rates but Mr Main Street is still buying. Not much to talk about until earnings season is over. After that Mr Market will focus on Spain and other bankrupted countries, inflation in China & India, protesters in Egypt and other volatile countries and maybe even the problem with US muni bonds and the bankrupted states.
Wednesday, September 8, 2010
Obama "smoke and mirrors". Is Wall Street going to be fooled ? Obana's problem is he is promising too much everytime he speaks.... how is America going to pay for everything ?
Tax cuts will end next year but Obama is trying to fool the middle class voter and give them tax cuts forever.
As Obama speaks the market drops and is currently holding.
S&P 1070 is support... will we break down in the next few days and test the 1040, then 1000, then 950 ???
As Obama speaks the market drops and is currently holding.
S&P 1070 is support... will we break down in the next few days and test the 1040, then 1000, then 950 ???
Monday, August 30, 2010
Will China's banks have another crisis ? Remember at one time NPL (non performing loans) were 30%
Currently NPLs are 1.7 %. Some analysts think this will move to over 7% in the next year. If housing gets into trouble the number could be 13%. Bankers are thinking loan growth is too high. Loans may not get repaid and capital will be eroded and need a capital injection. New loans doubled in the last year as China loosened credit... unsustainable model.
Tuesday, August 24, 2010
Hindenburg Omen ? Should you be "dancing close to the doors". Crappy housing data just released. Just wait until you see the crappy weekly jobs data and the big jobs data on the firdt Fri of each month! No jobs = bad housing data = no consumer spending = lower earnings = lower stock prices = happy bears
Wall Street has been whispering for a few weeks about the "Hindenburg Omen." Technical indicator that is supposed to signal an upcoming stock market crash.
The creator of this indicator recently said he is "dancing close to the door", ie. when the party is over, you want to be near the exit!
I have been bearish for a couple of months... S&P 500 target of 950... I'm now in good company. BofA/Merrill's market technical guru agrees !
BofA-Merrill's Mary Ann Bartels thinks the equity market has begun a correction that could last into October. "Since early August, the VIM (volume intensity model) shows rising distribution and falling accumulation. This suggests that sellers are stepping into the market."
And if the S&P 500 were to break 1010, she says, a deeper correction would become a bigger risk, with 950 and even 878 coming into view.
Earlier in the month she wrote that a head and shoulders pattern may be forming in the S&P with “a left shoulder at the January high, the head at the April high, and the right shoulder developing over the summer/fall.”
And if the S&P 500 were to break 1010, she says, a deeper correction would become a bigger risk, with 950 and even 878 coming into view.
Earlier in the month she wrote that a head and shoulders pattern may be forming in the S&P with “a left shoulder at the January high, the head at the April high, and the right shoulder developing over the summer/fall.”
Thursday, August 19, 2010
Bulls run for cover
Last week, the S&P 500 dropped more than 3% and the bulls scattered. In this week's survey, bullish sentiment declined 12% for its largest weekly decline since the flash crash.
Wednesday, August 18, 2010
Tuesday, August 10, 2010
What looks like a duck, quacks like a duck ? ....... a duck ! What will the Fed do today ?
So what looks like a economic slow down, quacks like an economic slow down ? ..... an economic slow down !
The world has been looking to China as the engine of growth to drive economies around the world and keep the stock markets up. Well today China's latest trade surplus for July was announced. China's trade deficit for July ($28.7 billion) increased by 40% from June ($20 billion). This increase was due to a very large decrease in imports swamping a smaller decrease in exports. Appears that economic activity in China, is slowing.
As said before, after earnings season, the market will start to concentrate on economic news again.
The Federal Open Markets Committee, the FOMC will make their much anticipated announcement at 2:15 p.m. ET. Will the Fed announce today that it’s completely exhausted its effective policy tools ?
The FOMC will leave the fed funds rate in this zero to 0.25% band. This has been the range for more than a year. What is the Fed’s going to do next to stop the economy from decelerating, or rolling over ?
There is not much more for them to do. Maybe the Fedwill take the maturing assets on its balance sheet, and redeploying the money it gets back into the bond market. This is the prayer that has been keeping the market strong. If the Fed activates this program, it would be a neutral move at best. What is needed is job growth and consumer spending. Fed liquidity is not the problem.

The world has been looking to China as the engine of growth to drive economies around the world and keep the stock markets up. Well today China's latest trade surplus for July was announced. China's trade deficit for July ($28.7 billion) increased by 40% from June ($20 billion). This increase was due to a very large decrease in imports swamping a smaller decrease in exports. Appears that economic activity in China, is slowing.
As said before, after earnings season, the market will start to concentrate on economic news again.
The Federal Open Markets Committee, the FOMC will make their much anticipated announcement at 2:15 p.m. ET. Will the Fed announce today that it’s completely exhausted its effective policy tools ?
The FOMC will leave the fed funds rate in this zero to 0.25% band. This has been the range for more than a year. What is the Fed’s going to do next to stop the economy from decelerating, or rolling over ?
There is not much more for them to do. Maybe the Fedwill take the maturing assets on its balance sheet, and redeploying the money it gets back into the bond market. This is the prayer that has been keeping the market strong. If the Fed activates this program, it would be a neutral move at best. What is needed is job growth and consumer spending. Fed liquidity is not the problem.
Tuesday, August 3, 2010
Friday, July 30, 2010
dow future down 81, S&P futures down 8, US GDP slows to 2.4%
Economy Grew 2.4% in Second Quarter, Slightly Less than Analysts Were Expecting
Thursday, July 29, 2010
S&P 500 opens strong and now down 11. Stalls at the Fibonacci Line again
Where is the market going ? Looks like talk of the double dip recession is fading. For the past 2 weeks, Wall Street has been focusing on earnings announcements and they are not that bad as first thought by the gurus. Plus Europe doesn't have as many banks failing after the stress test last Friday. Where is the market going ?
Well I am sticking to my thesis of volatility and the trading range I mentioned early in the month. I think the market has a greater chance of correcting than starting a new bull. What does the market do after earnings season ? .... focus on other news (economic stats, US state debt problems, credit crisis with the PIGS, Korea etc...) Time will tell !!! Be careful out there !!
Subscribe to:
Posts (Atom)