

When the VIX is low, the market is complacent and ready for a correction and when the VIX is high, the market is scared and should be bought !!!
Horizontal green line shows when the market should be bought (high VIX reading or market has some bad news) and the horizontal red line shows when the market should be sold. (low VIX reading and market news is all goo)

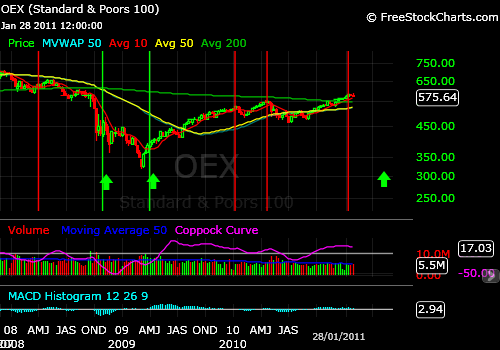
Vertical red line corresponds with low VIX (SELL) and vertical green line corresponds with high VIX (BUY).
When is the next vertical green line or buy signal ??? Wait for the VIX to climb higher !!!
No comments:
Post a Comment